View Results (Interface)
Report Type
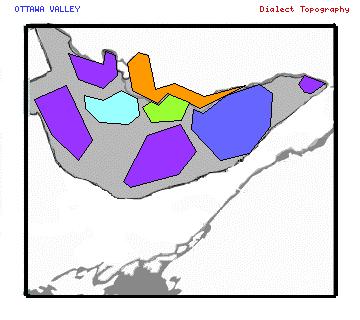
Regional Maps
Regional Report
By Subregion
Individual Record by Index
Project Region
Question
Window Name
Independent Variable
Graph
None Top Response Top Two ResponsesPercentage Threshold
Show all percentagesOmit null responses
Do not show percentages below %
First colour
Second colour
Apparent Time Graphing program